Charts and Maps
Here are a few examples of different types of graphics you can create through TruServe. Graphics are generated with just a few clicks and are completely customizable to show the data you need.
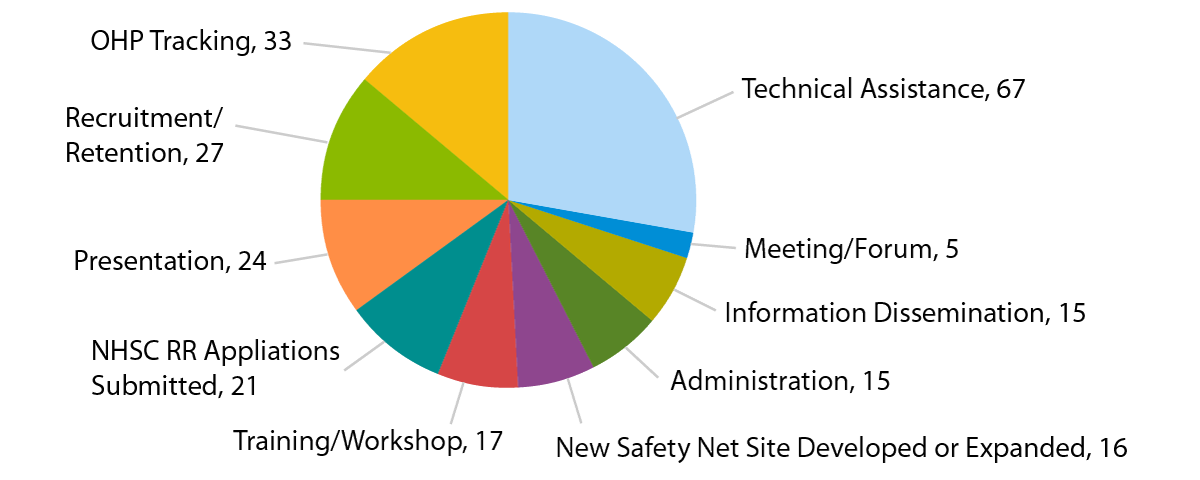
Activities by Type
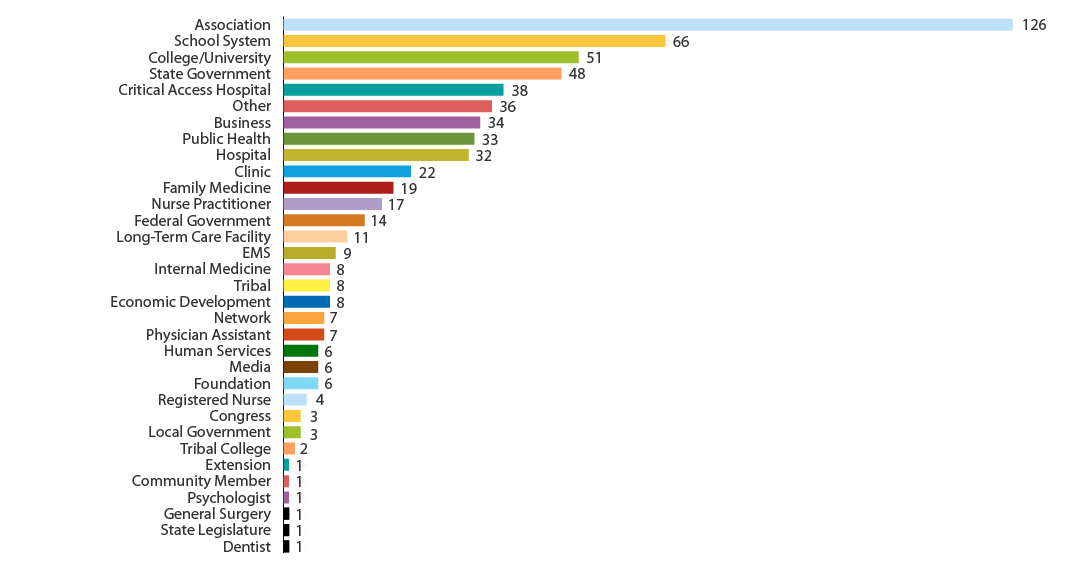
Activities by Attached Organization Type
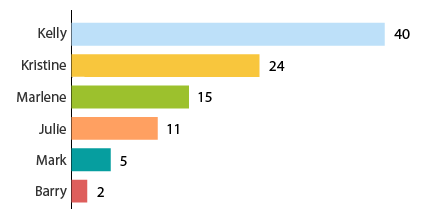
Activities by Staff
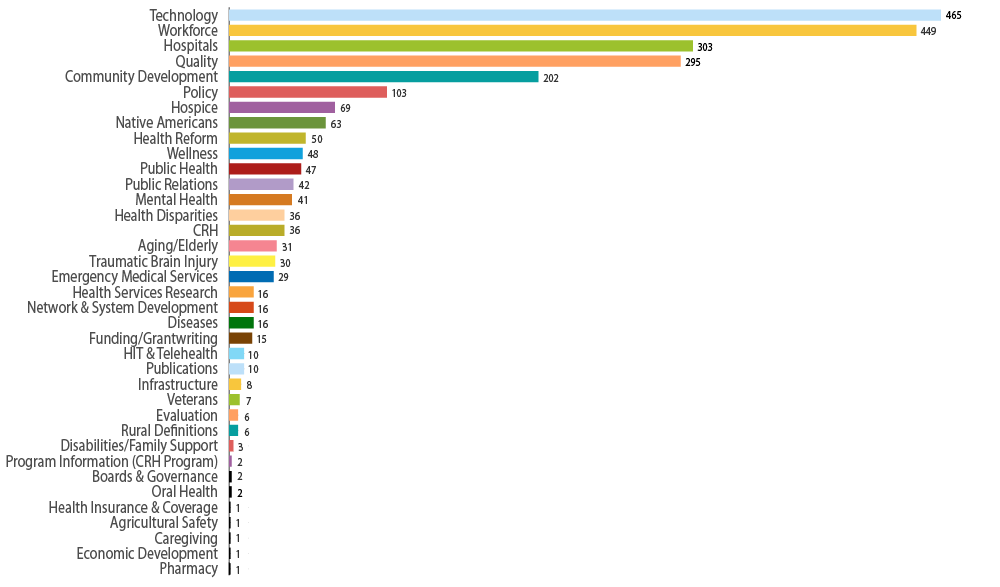
Activities by Topic
Map of Reach Across Counties by Number of Activities
