Accurate reporting is essential in today’s economy, with funders and stakeholders expecting quantifiable
results demonstrating the impact of their investment
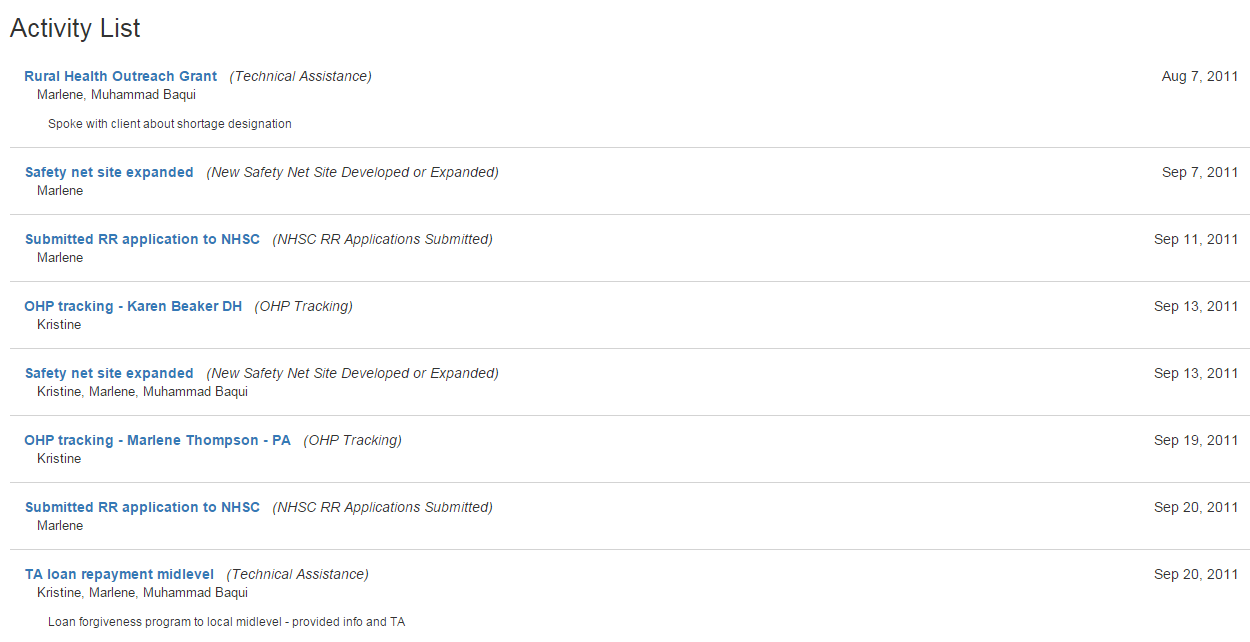
TruServe effectively tracks activities and associates them with other variables such as time, budget,
program goals, level of assistance, location of customers, staff and much more
Time is saved by using TruServe. Effort and impact can be shared quickly
TruServe eliminates the need for specialized staff training required for mapping and graphing results.
Graphics are built into the system and are easily exported to others programs such as Microsoft Word, Excel
and PowerPoint
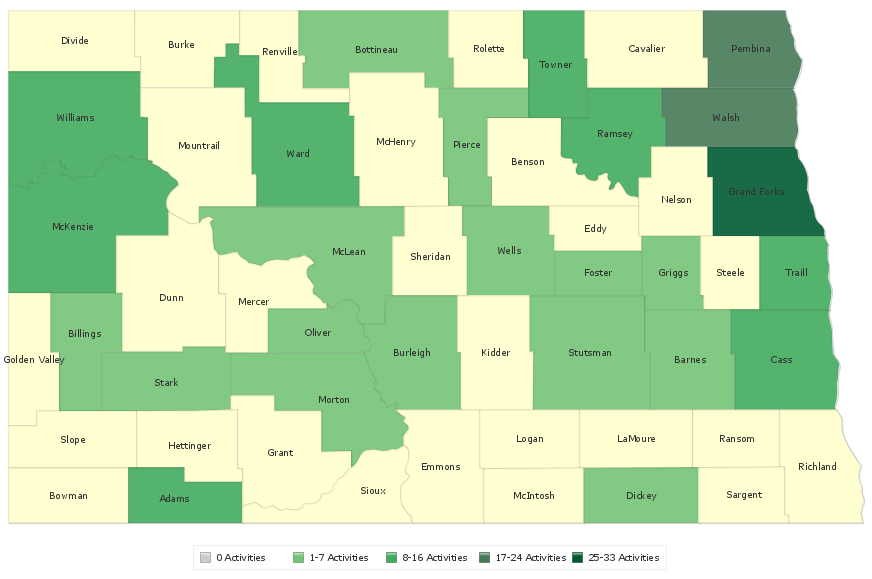
Maps are generated within TruServe to show number of activities by county. Mapping results can be filtered
to show activities only by staff, projects, budget, and much more
Mapping locations come from a database of over 10,000 US cities
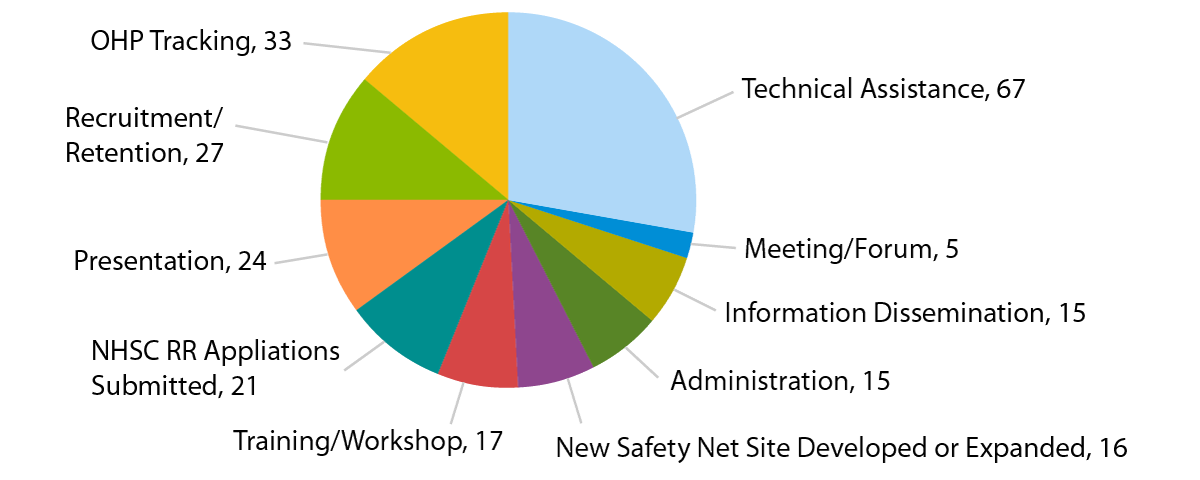
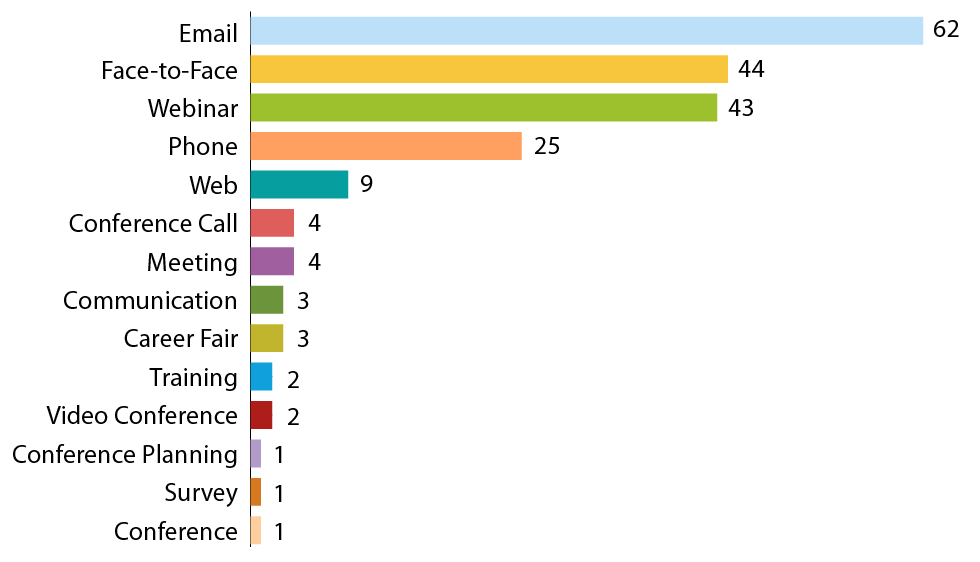
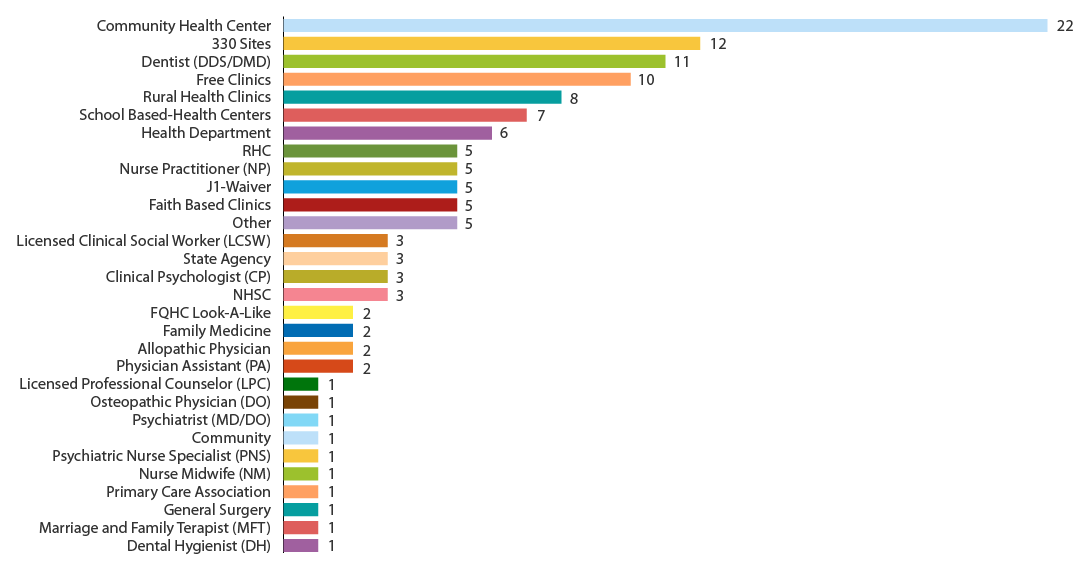
Graphs and charts from TruServe are customizable to show desired information